Grafy.mw
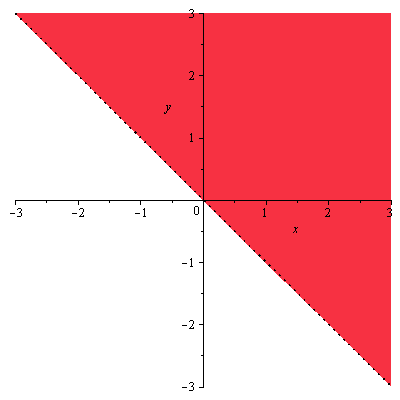
Určete definiční obor funkce a zakreslete jej do roviny.
ln(x+y)
funkce
definiční obor
| > |
implicitplot(x+y>0,x=-3..3,y=-3..3,filledregions=true); |
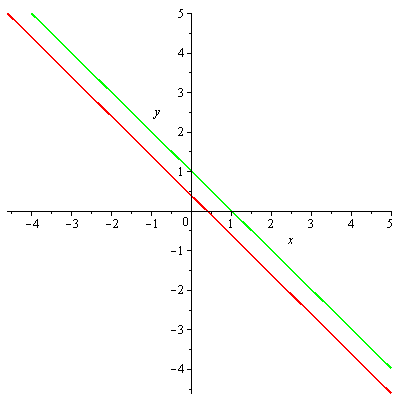
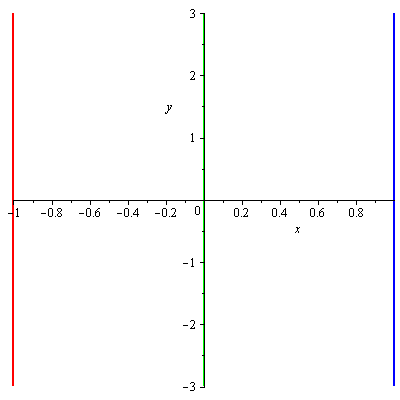
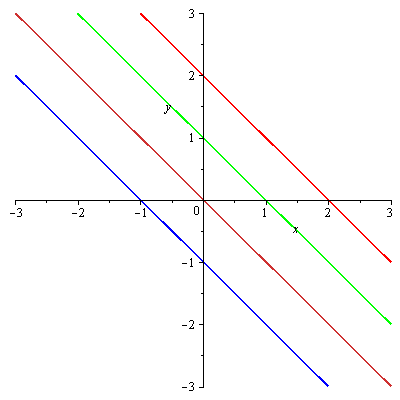
vrstevnice
| > |
implicitplot([f1(x,y)=-1,f1(x,y)=0,f2(x,y)=1], x=-5..5, y=-5..5,gridrefine = 2, grid=[10,10], color=[red,green,blue]); |
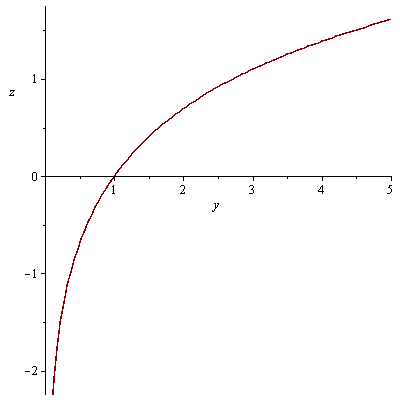
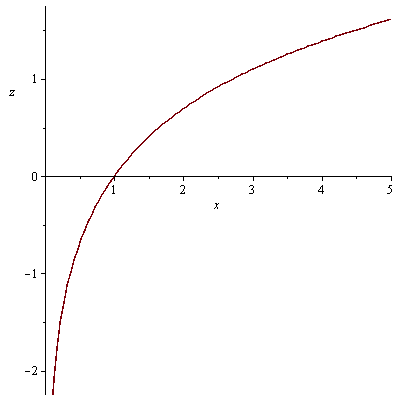
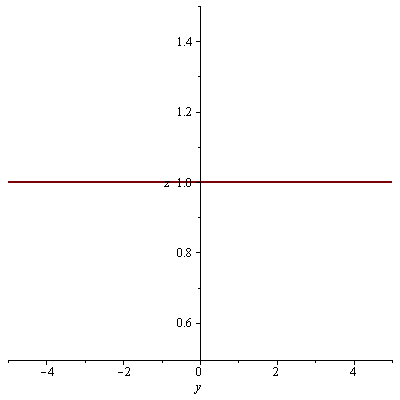
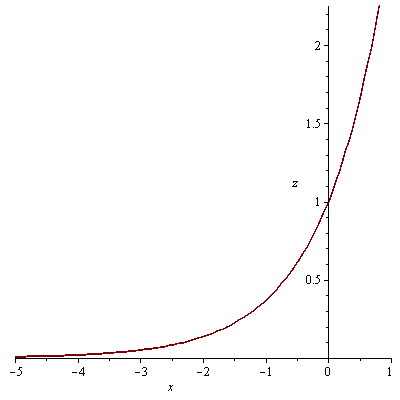
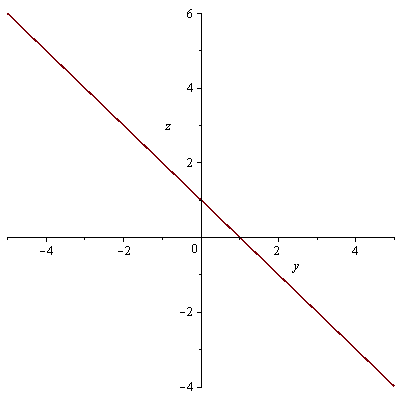
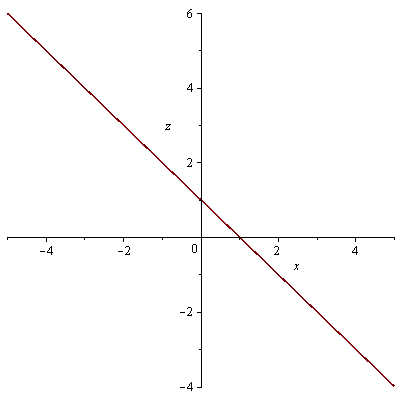
průsečnice s rovinami x=0 a y=0
| > |
plot(f1(0,y),y=-5..5, labels=[y, z]); plot(f1(x,0),x=-5..5, labels=[x, z]); |
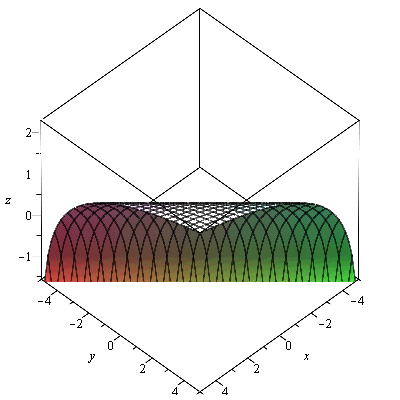
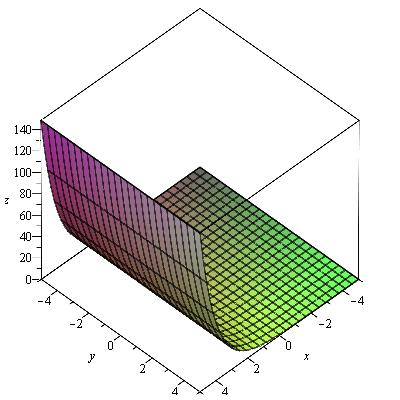
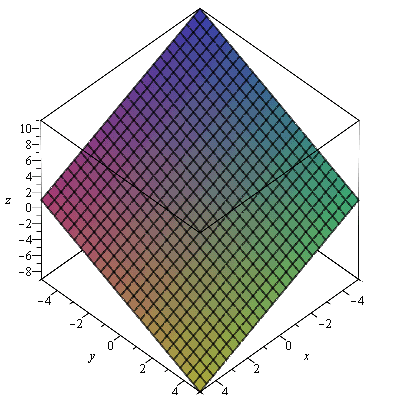
graf
| > |
plot3d(f1, -5..5, -5..5, labels=[x, y, z]); |
sqrt(1-x^2)+sqrt(y^2-1)
funkce
| > |
f2:=(x,y)->sqrt(1-x^2)+sqrt(y^2-1); |
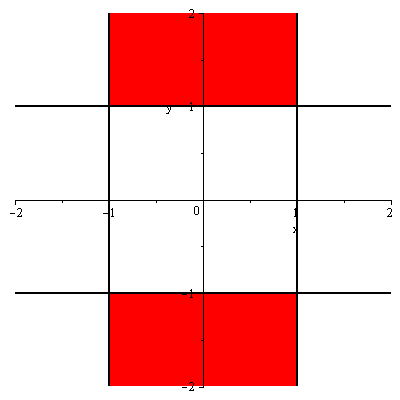
definiční obor
| > |
inequal( {1-x^2>=0,y^2-1>=0}, x=-2..2, y=-2..2, color=red); |
vrstevnice
| > |
implicitplot([f2(x,y)=1,f2(x,y)=2], x=-1..1, y=-5..5,gridrefine = 2, color=[red,green]); |
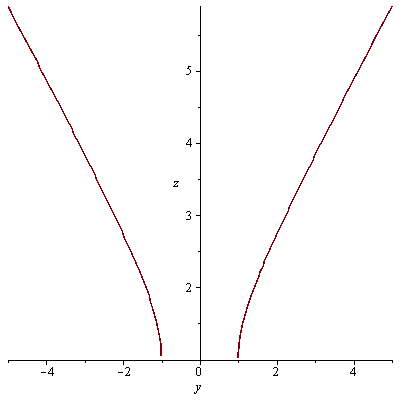
průsečnice s rovinami x=0 a y=0
| > |
plot(f2(0,y),y=-5..5, labels=[y, z]); plot(f2(x,0),x=-5..5, labels=[x, z]); |
 |
| Warning, unable to evaluate the function to numeric values in the region; complex values were detected |
 |
|
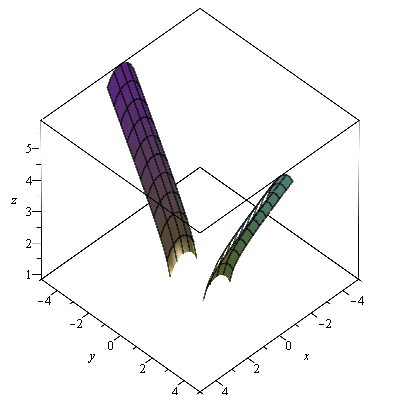
graf
| > |
plot3d(f2, -5..5, -5..5, labels=[x, y, z]); |
sqrt(1-x^2-y^2)
funkce
| > |
f3:=(x,y)->sqrt(1-x^2-y^2); |
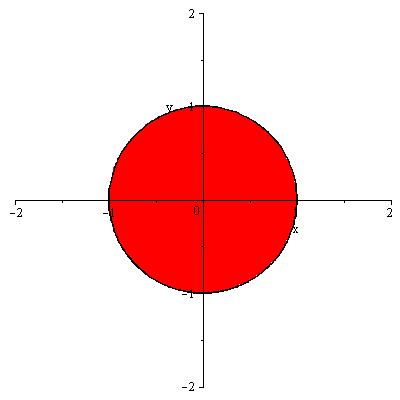
definiční obor
| > |
inequal( {1-x^2-y^2>=0}, x=-2..2, y=-2..2, color=red); |
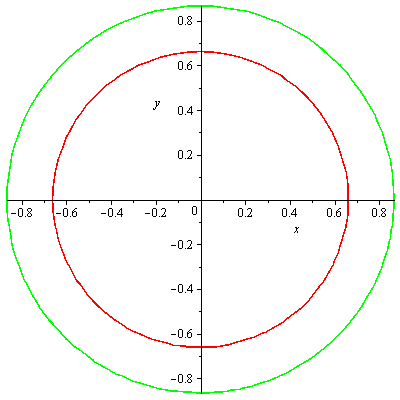
vrstevnice
| > |
implicitplot([1-x^2-y^2=0.75^2,1-x^2-y^2=0.5^2], x=-3..3, y=-3..3,gridrefine = 2, color=[red,green]); |
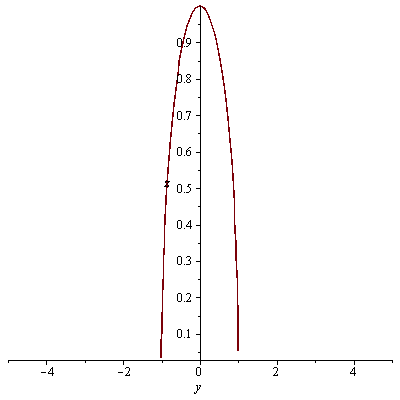
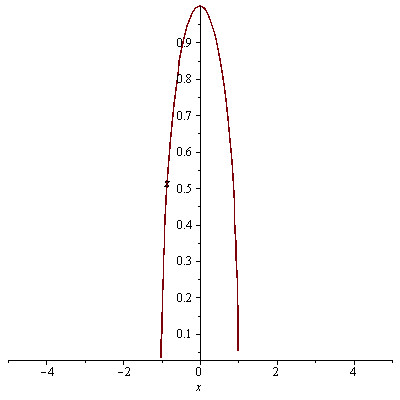
průsečnice s rovinami x=0 a y=0
| > |
plot(f3(0,y),y=-5..5, labels=[y, z]); plot(f3(x,0),x=-5..5, labels=[x, z]); |
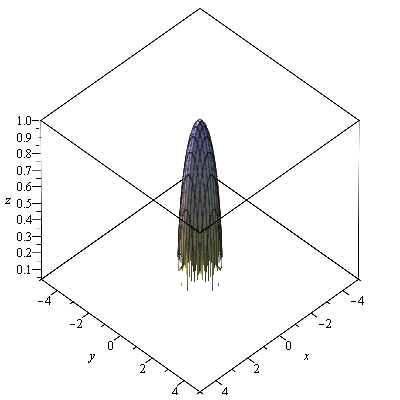
graf
| > |
plot3d(f3, -5..5, -5..5,numpoints=10^5, labels=[x, y, z]); |
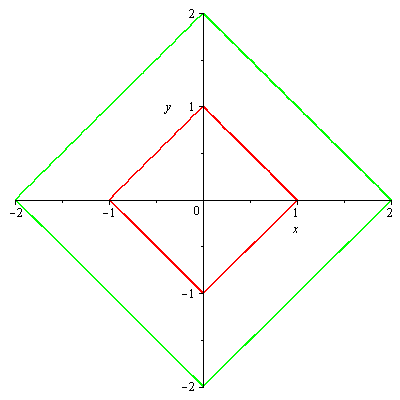
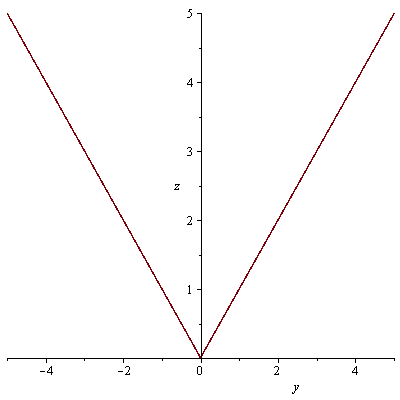
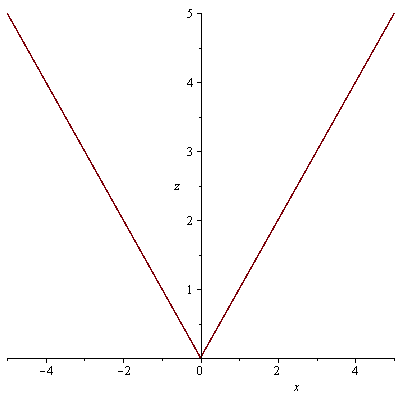
Určete a zakreslete do roviny vrstevnice funkce a její průsečnice s rovinami x=0 a y=0.
|x|+|y|
funkce
| > |
f4:=(x,y)->abs(x)+abs(y); |
vrstevnice
| > |
implicitplot([f4(x,y)=1,f4(x,y)=2], x=-3..3, y=-3..3,gridrefine = 2, color=[red,green]); |
průsečnice s rovinami x=0 a y=0
| > |
plot(f4(0,y),y=-5..5, labels=[y, z]); plot(f4(x,0),x=-5..5, labels=[x, z]); |
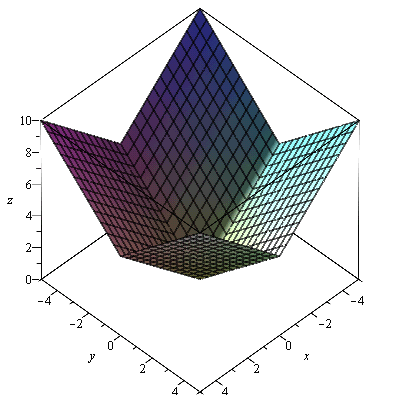
graf
| > |
plot3d(f4, -5..5, -5..5, labels=[x, y, z]); |
sqrt(x^2+y^2)
funkce
| > |
f5:=(x,y)->sqrt(x^2+y^2); |
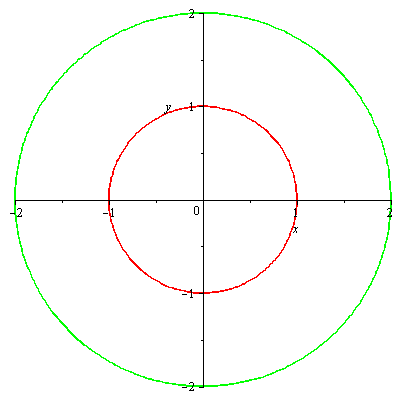
vrstevnice
| > |
implicitplot([f5(x,y)=1,f5(x,y)=2], x=-3..3, y=-3..3,gridrefine = 2, color=[red,green]); |
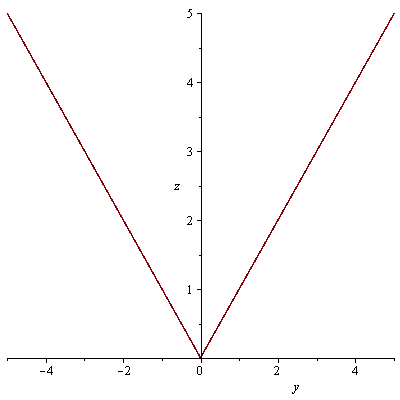
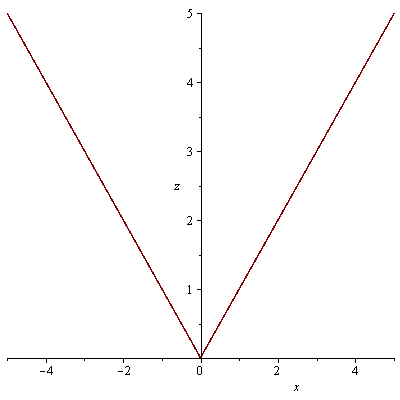
průsečnice s rovinami x=0 a y=0
| > |
plot(f5(0,y),y=-5..5, labels=[y, z]); plot(f5(x,0),x=-5..5, labels=[x, z]); |
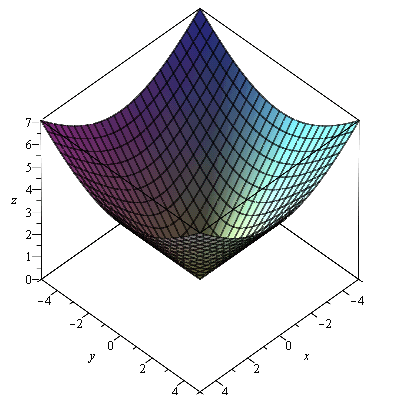
graf
| > |
plot3d(f5, -5..5, -5..5, labels=[x, y, z]); |
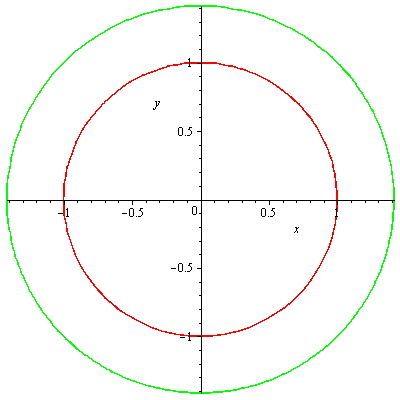
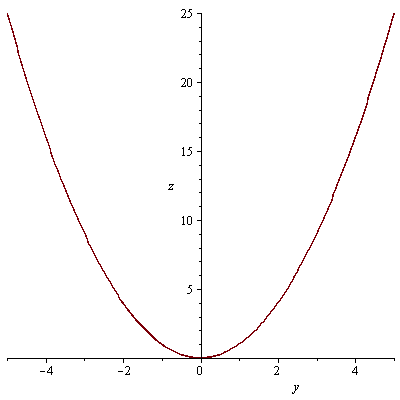
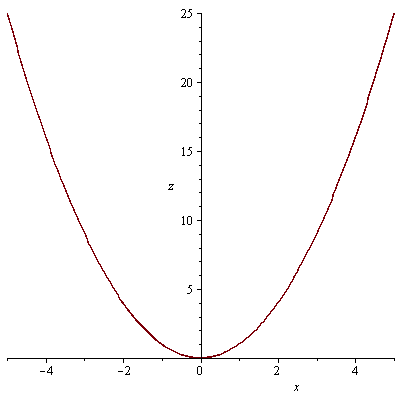
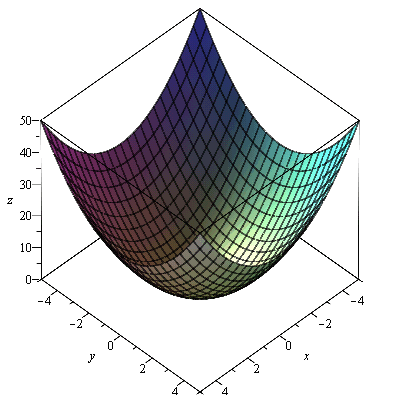
x^2+y^2
funkce
vrstevnice
| > |
implicitplot([f6(x,y)=1,f6(x,y)=2], x=-3..3, y=-3..3,gridrefine = 2, color=[red,green]); |
průsečnice s rovinami x=0 a y=0
| > |
plot(f6(0,y),y=-5..5, labels=[y, z]); plot(f6(x,0),x=-5..5, labels=[x, z]); |
graf
| > |
plot3d(f6, -5..5, -5..5, labels=[x, y, z]); |
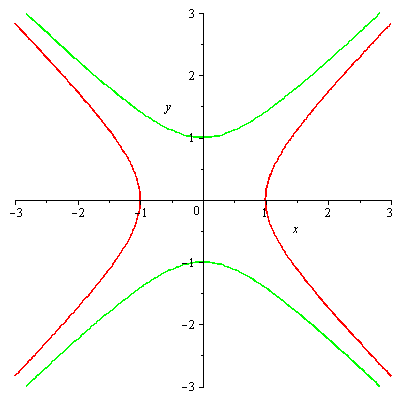
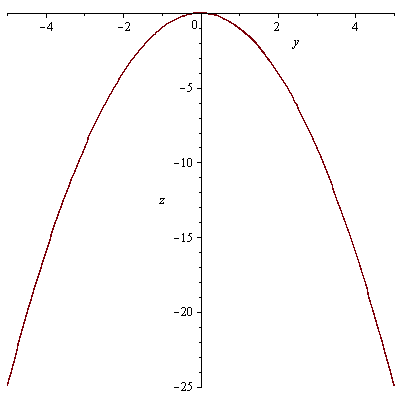
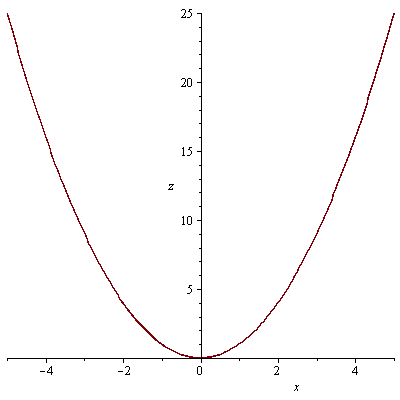
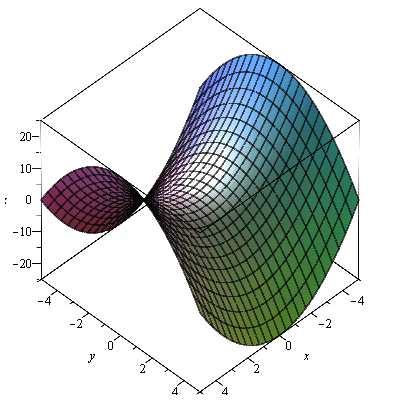
x^2-y^2
funkce
vrstevnice
| > |
implicitplot([f7(x,y)=1,f7(x,y)=-1], x=-3..3, y=-3..3,gridrefine = 2, color=[red,green]); |
průsečnice s rovinami x=0 a y=0
| > |
plot(f7(0,y),y=-5..5, labels=[y, z]); plot(f7(x,0),x=-5..5, labels=[x, z]); |
graf
| > |
plot3d(f7, -5..5, -5..5, labels=[x, y, z]); |
exp(x)
funkce
vrstevnice
| > |
implicitplot([f8(x,y)=exp(-1),f8(x,y)=1,f8(x,y)=exp(1)], x=-3..3, y=-3..3,gridrefine = 2,color=[red,green,blue]); |
průsečnice s rovinami x=0 a y=0
| > |
plot(f8(0,y),y=-5..5, labels=[y, z]); plot(f8(x,0),x=-5..5, labels=[x, z]); |
graf
| > |
plot3d(f8, -5..5, -5..5, labels=[x, y, z]); |
1-x-y
funkce
vrstevnice
| > |
implicitplot([f9(x,y)=-1,f9(x,y)=0,f9(x,y)=1,f9(x,y)=2], x=-3..3, y=-3..3, color=[red,green,orange,blue]); |
průsečnice s rovinami x=0 a y=0
| > |
plot(f9(0,y),y=-5..5, labels=[y, z]); plot(f9(x,0),x=-5..5, labels=[x, z]); |
graf
| > |
plot3d(f9, -5..5, -5..5, labels=[x, y, z]); |
Určete definiční obor funkce
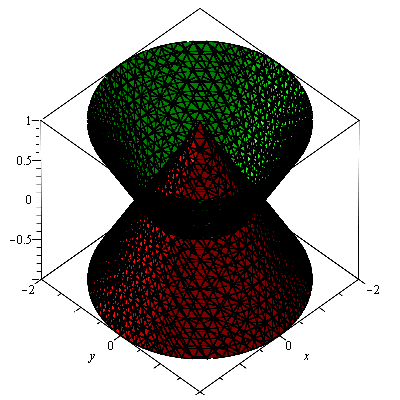
sqrt(1-sqrt(x^2+y^2)-z)+sqrt(1-sqrt(x^2+y^2)+z)
| > |
implicitplot3d([1-sqrt(x^2+y^2)-z=0,1-sqrt(x^2+y^2)+z=0], x=-2..2, y=-2..2, z=-1..1, grid = [25,25,25], color=[red,green], labels=[x, y, z]); |
Definičním oborem je "káča", prostor tvořený průnikem dvou kuželů.
